COIN Revenue Bridge: Coinbase Consumer Revenue, Q3 to Q4 2024
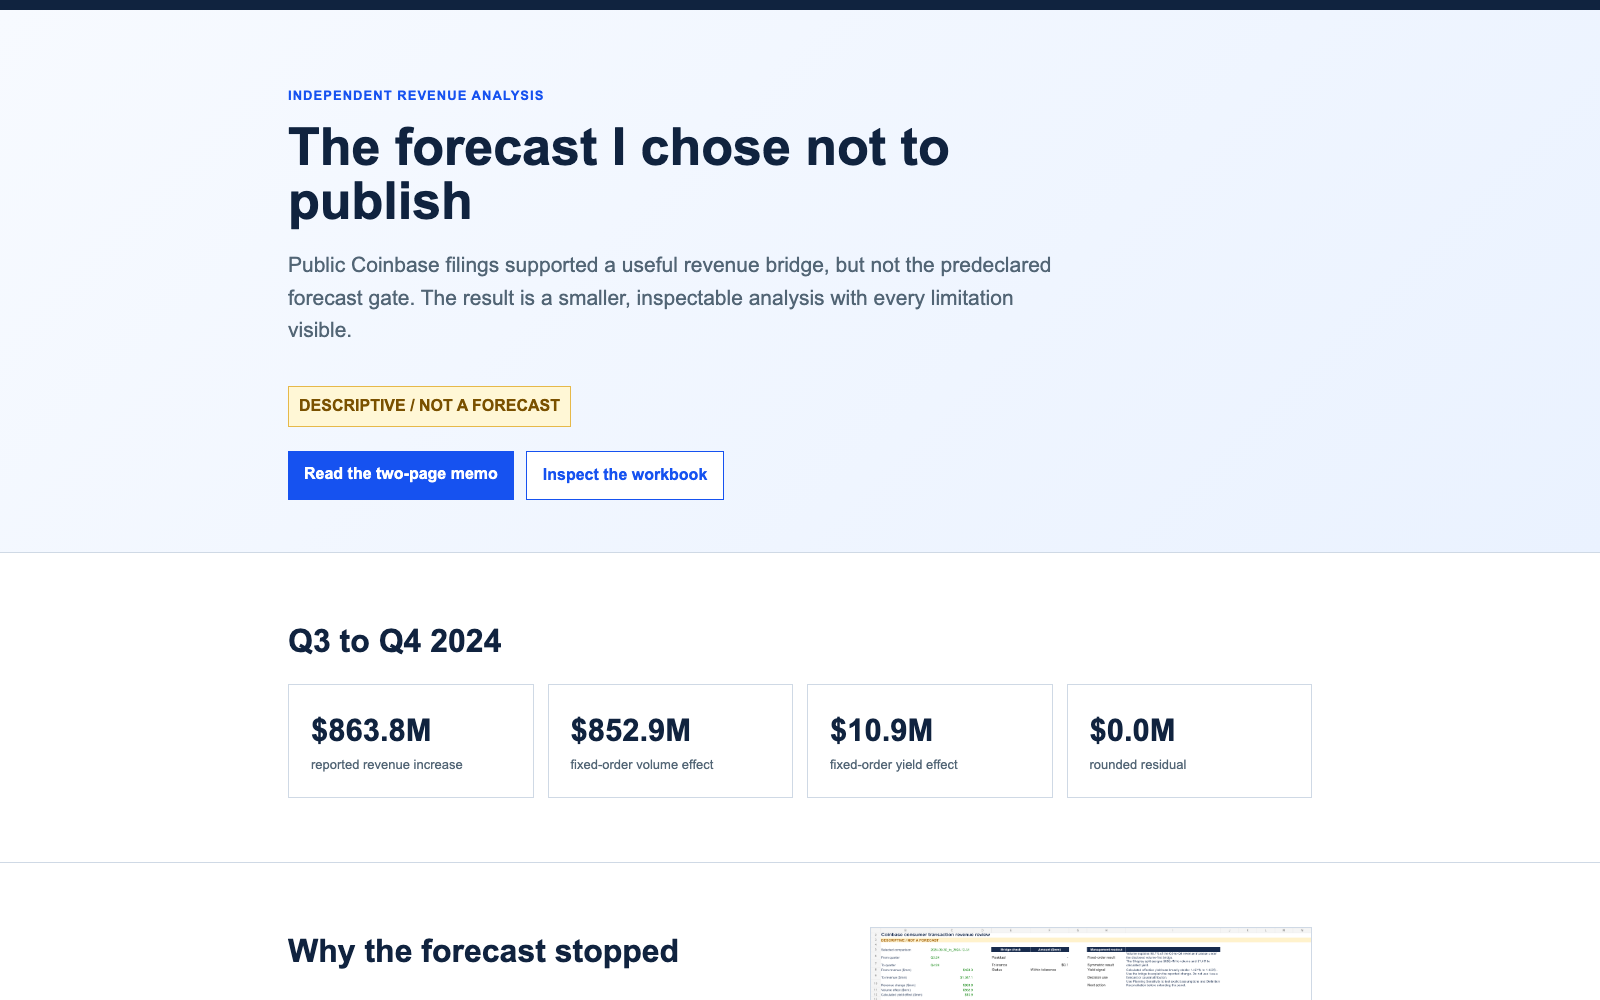
A source-backed bridge that splits Coinbase's $863.8M Q3 to Q4 2024 rise in consumer transaction revenue into volume and effective-yield effects, built only from public SEC filings, with a reproducible workbook and memo.
- Problem
- Coinbase's consumer transaction revenue rose from $483.3M in Q3 2024 to $1,347.1M in Q4 2024. Did customers trade more, or did Coinbase earn more on each dollar traded? The answer shapes how a planner should think about the next quarter, and the public numbers change definition over time, so a careless series mixes numbers that do not compare.
- Solution
- Built a Python and SQLite core over 13 frozen SEC documents that keeps original and recast values apart, enforces information cutoffs and definition families, and computes the bridge with decimal arithmetic in three factor orders. It feeds a two-page memo, a seven-sheet formula workbook, a reviewer packet, and a live case study, plus a standalone script that recomputes the bridge from package files.
Overview
The question: Coinbase’s consumer transaction revenue rose $863.8M from Q3 to Q4 2024. How much came from more trading volume, and how much from earning more per dollar traded?
The answer: Volume drove almost all of it. Consumer spot volume rose from $34B to $94B, and the volume effect accounts for $852.9M to $859.9M of the $863.8M change, depending on the order in which the factors are applied.
Scope: Independent analysis of public filings. Not affiliated with or endorsed by Coinbase, and uses no internal Coinbase data.
The Answer
The split depends on factor order, so the analysis shows all three valid views:
| Bridge method | Volume effect | Effective-yield effect | Total |
|---|---|---|---|
| Volume first | $852.9M | $10.9M | $863.8M |
| Yield first | $859.9M | $3.9M | $863.8M |
| Symmetric Shapley | $856.4M | $7.4M | $863.8M |
Each view reconciles to the reported change with a $0.0M rounded residual. Effective yield is consumer revenue divided by consumer spot volume. It is a proxy, not Coinbase’s fee rate.
Planning sensitivities
Around the Q4 2024 actuals:
| Case | Volume change | Yield change | Implied revenue |
|---|---|---|---|
| Downside | -20% | -10 bps | $1,002.5M |
| Reference (Q4 2024 actual) | 0% | 0 bps | $1,347.1M |
| Upside | +20% | +10 bps | $1,729.3M |
These are mechanical sensitivities, not guidance, probabilities, or forecasts.
Why there is no forecast
The design set a gate before looking at results: at least twelve comparable quarters, eight to train and four to test. The public filings support nine under one definition. Coinbase reclassified consumer revenue in Q1 2024 and later redefined trading volume, so a longer series would mix incompatible numbers. The project reports the bridge and publishes no forecast.
How It Was Built
Sources
13 public documents, all from SEC EDGAR: ten Coinbase shareholder letters (Q3 2023 to Q4 2025) filed as 8-K exhibits, the 2025 Form 10-K, the Q2 2026 earnings deck, and the SEC submissions index. Each is frozen with a SHA-256 hash, and a source register lists the URL, accession number, and hash for every document.
Approach
- One row per metric, quarter, and vintage. Reviewed observations keep original and recast values as separate rows, so a restated number never overwrites the one first published.
- Cutoffs and definition families. A Python and SQLite core only lets a calculation use numbers that were public at the time and that share a definition.
- Decimal arithmetic in three orders. Volume first, yield first, and the symmetric Shapley split, each reconciled to the reported change.
Checks
- Unit tests over the core, run in CI
- A standalone
reproduce.pyin the reviewer package that recomputes the bridge from package-local files - An evidence validator that exits non-zero if any check fails
- A reviewer packet that lists the strongest objections and how to test them
What to Open First
- Live case study: rahilbhavan.github.io/coin-revenue-bridge
- Decision memo (PDF): the two-page memo
- Repository: github.com/RahilBhavan/coin-revenue-bridge. The core, the source register, and the seven-sheet workbook.
Scope & Limits
- Independent analysis of public filings. Not affiliated with or endorsed by Coinbase, and uses no internal Coinbase data.
- Descriptive only: the bridge explains a reported change. It makes no causal claim, forecast, or investment recommendation.
- Consumer spot volume excludes derivatives, and some consumer revenue does not tie to spot volume, so effective yield is a proxy.
- No outside practitioner has reviewed the work yet.
Completed: September 23, 2026