OpenEden RWA Intelligence Suite
A consulting engagement delivering three research modules for OpenEden’s RWA products: PRISM, USDO, and TBILL — with reproducible pipelines, charts, and tests.
What shipped
Module 1 — Competitive Landscape
Competitive matrix for PRISM vs tokenized yield peers (Ondo, Maple, Superstate, Hamilton Lane), plus a value prop and investor objection handler with confidence levels and sourcing where available.
- Outputs: Competitive matrix, notes on apples-to-oranges comparisons
- Scope: What’s knowable today vs what’s undisclosed / needs verification
Module 2 — On-chain Velocity & Holder Behavior
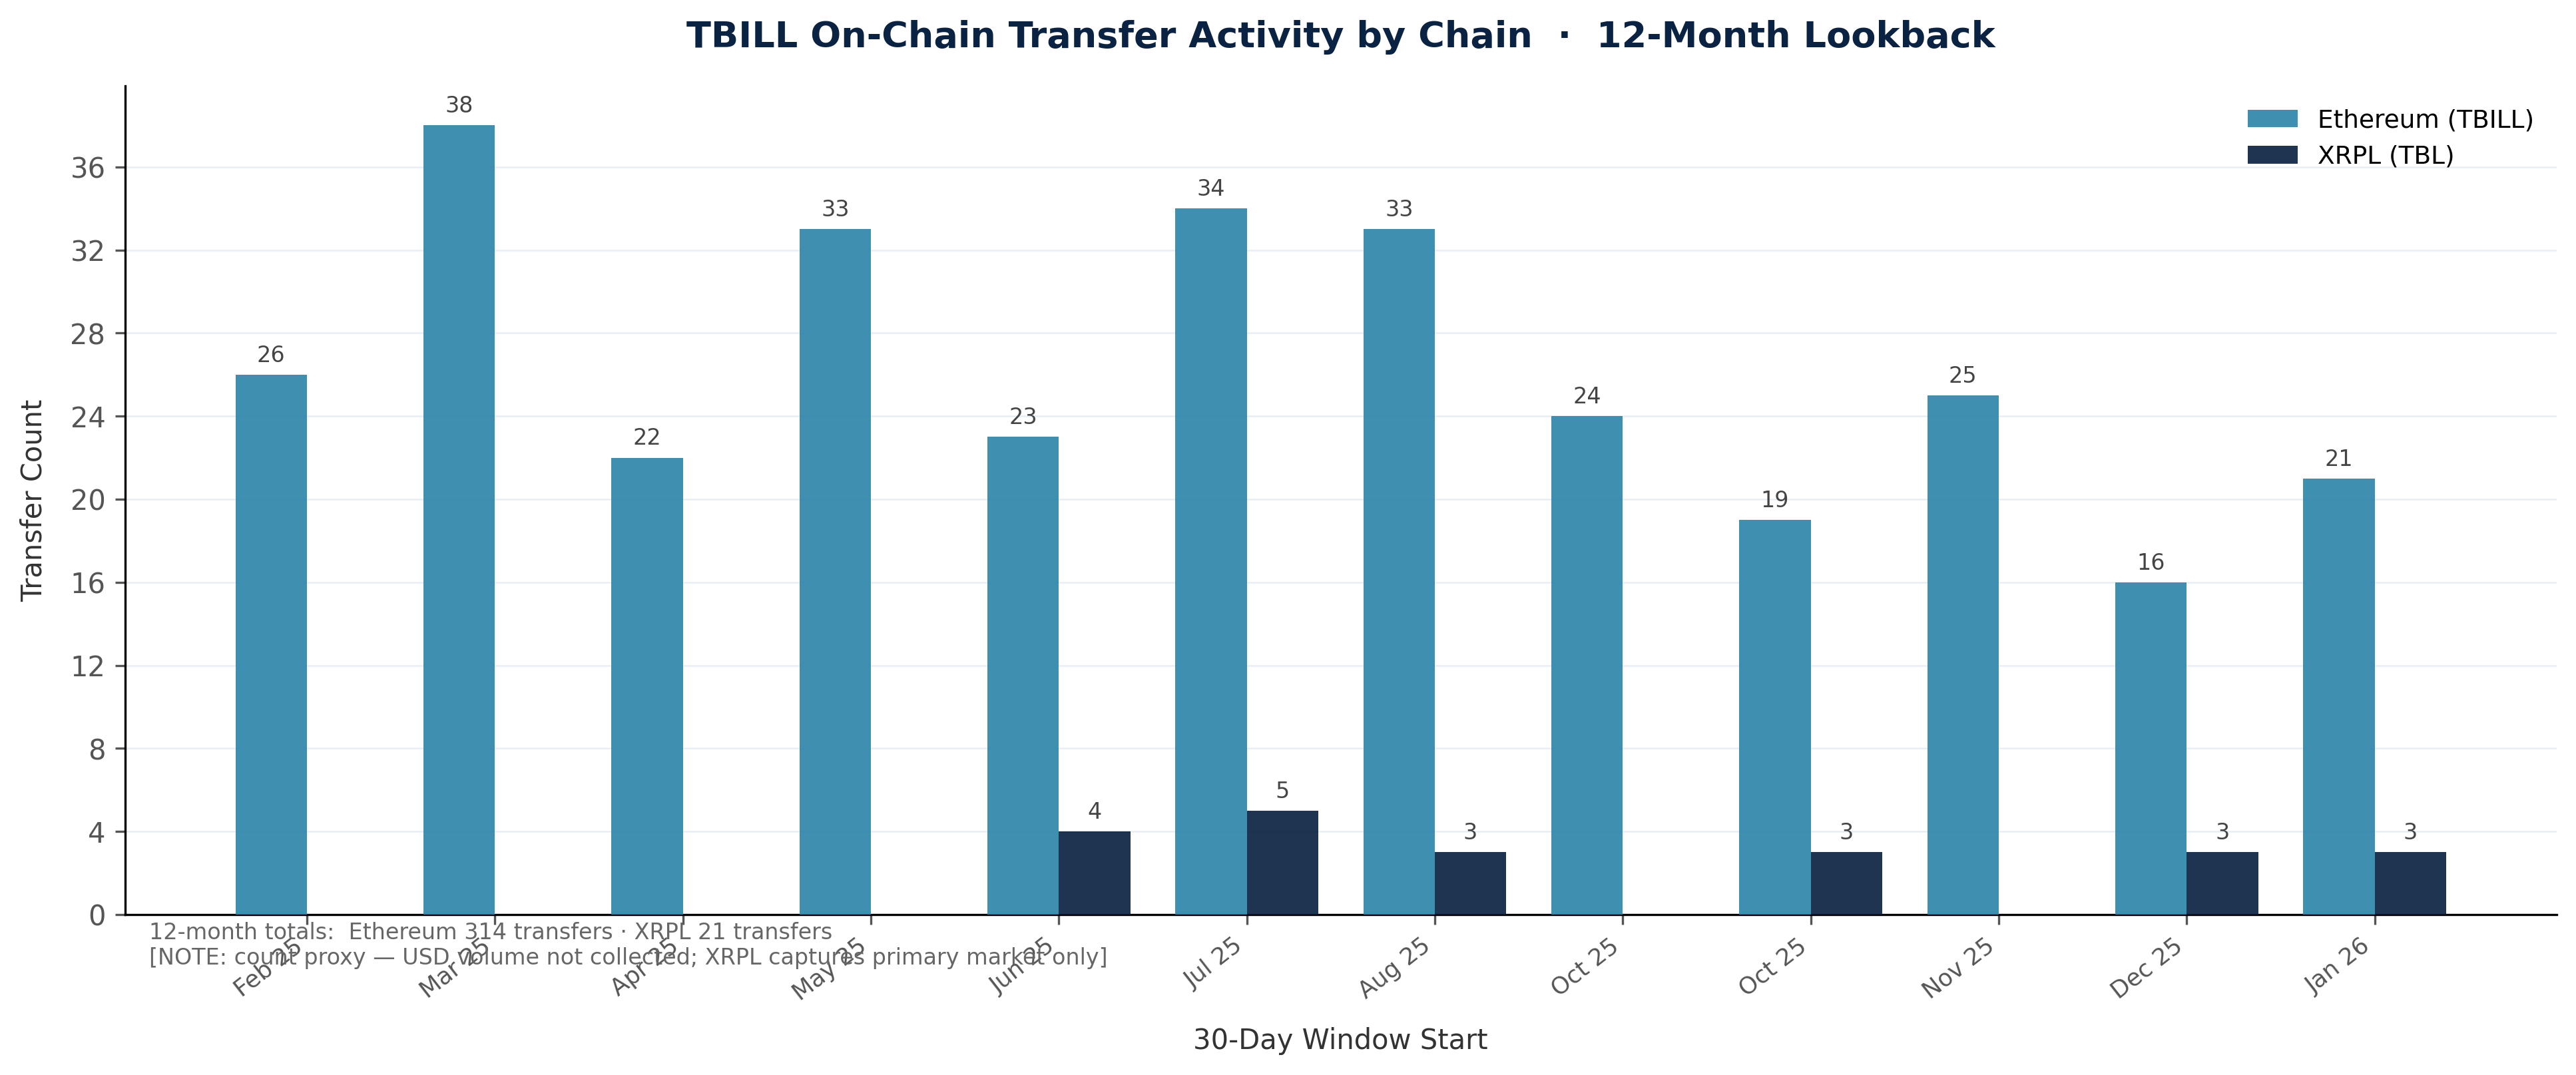
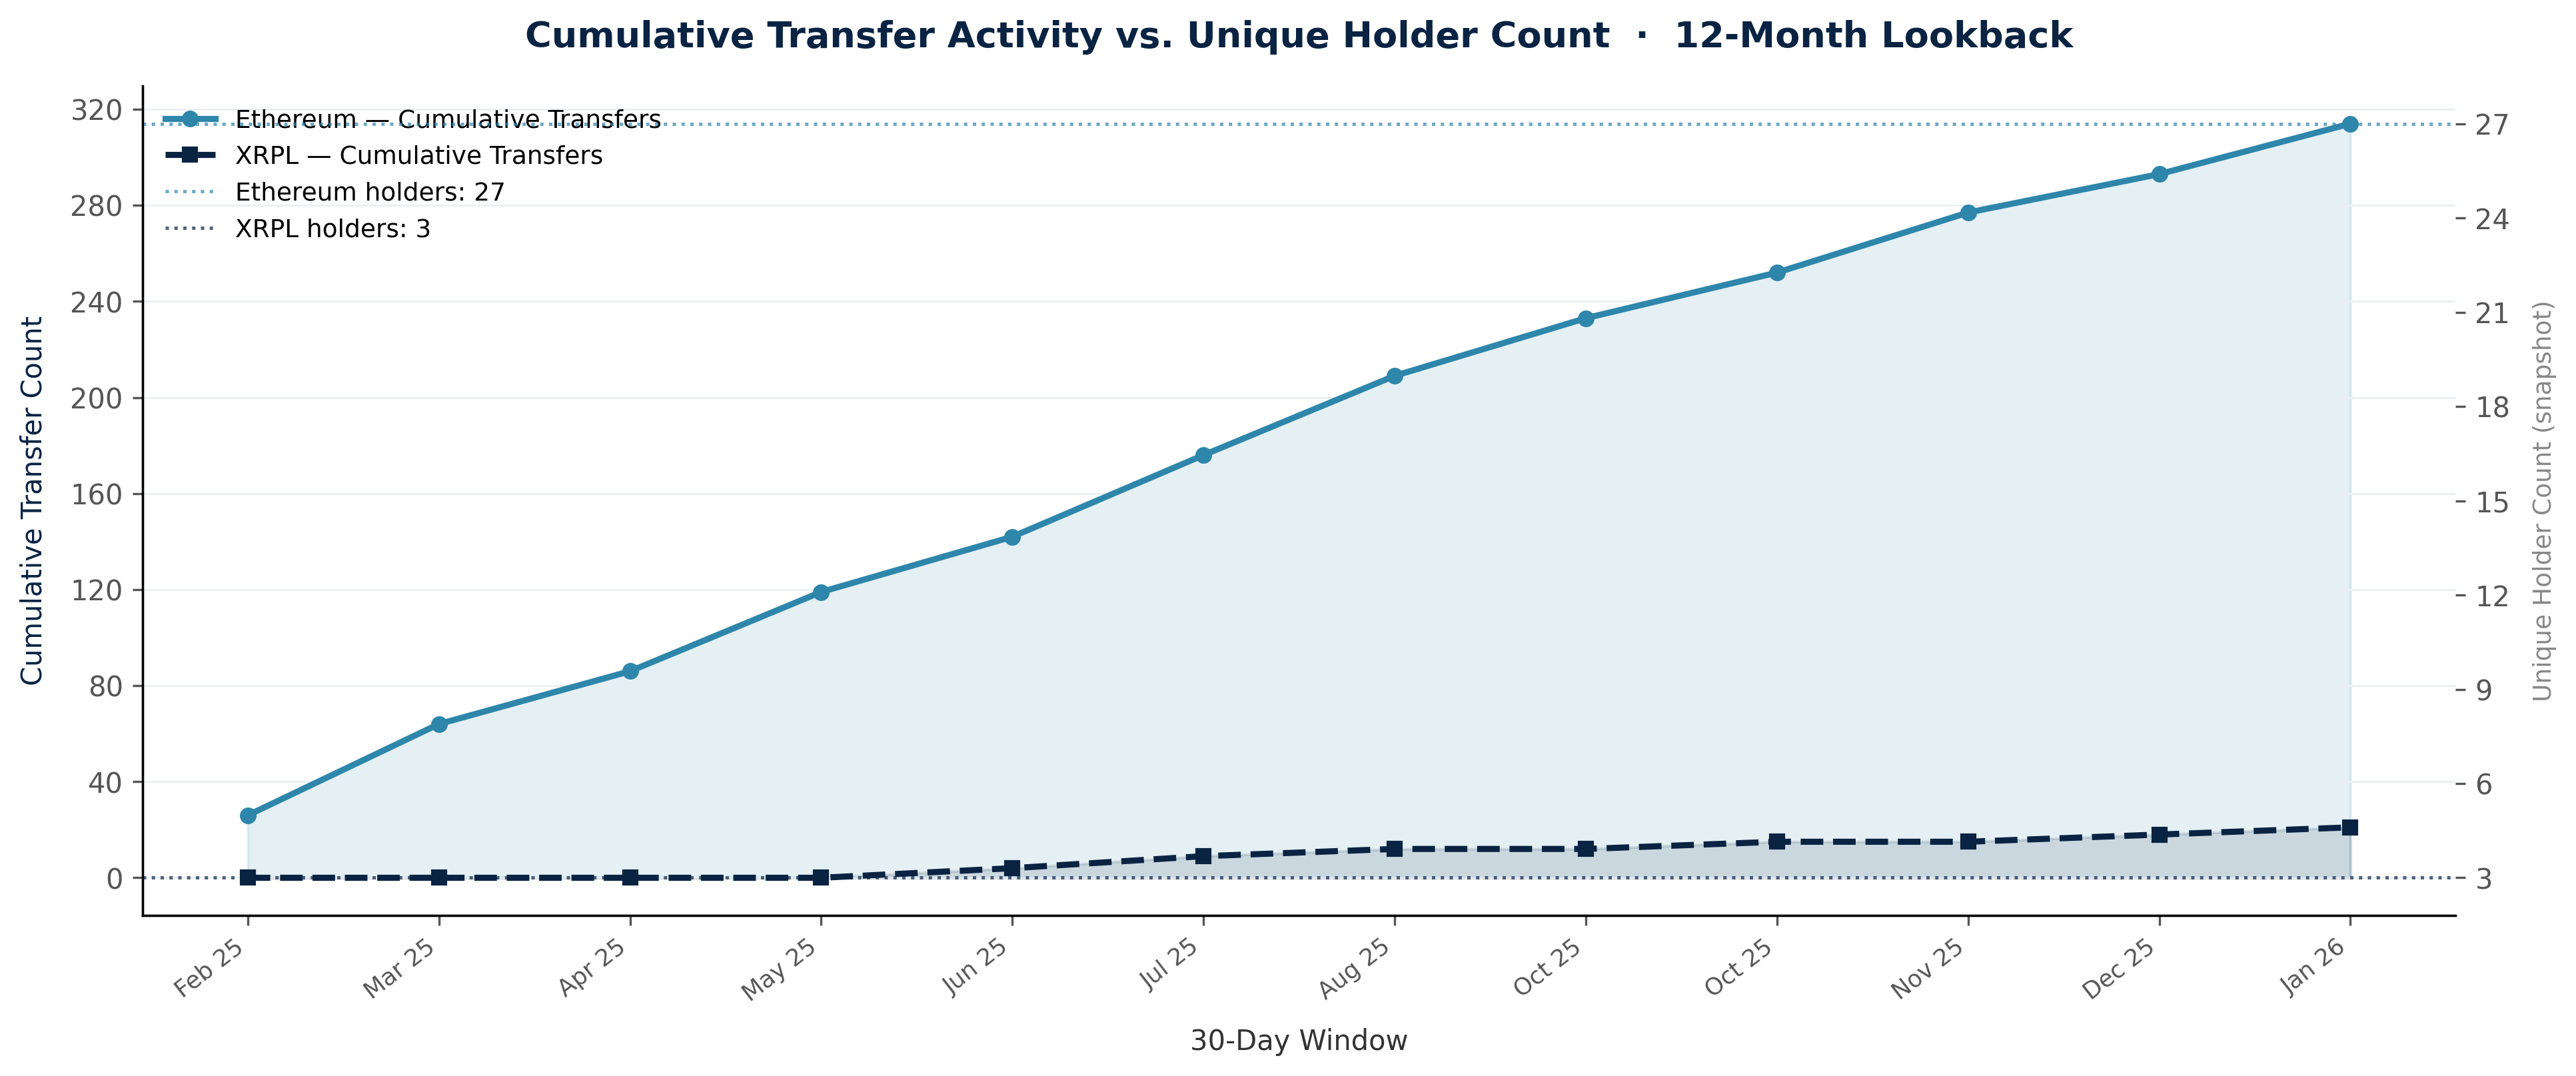
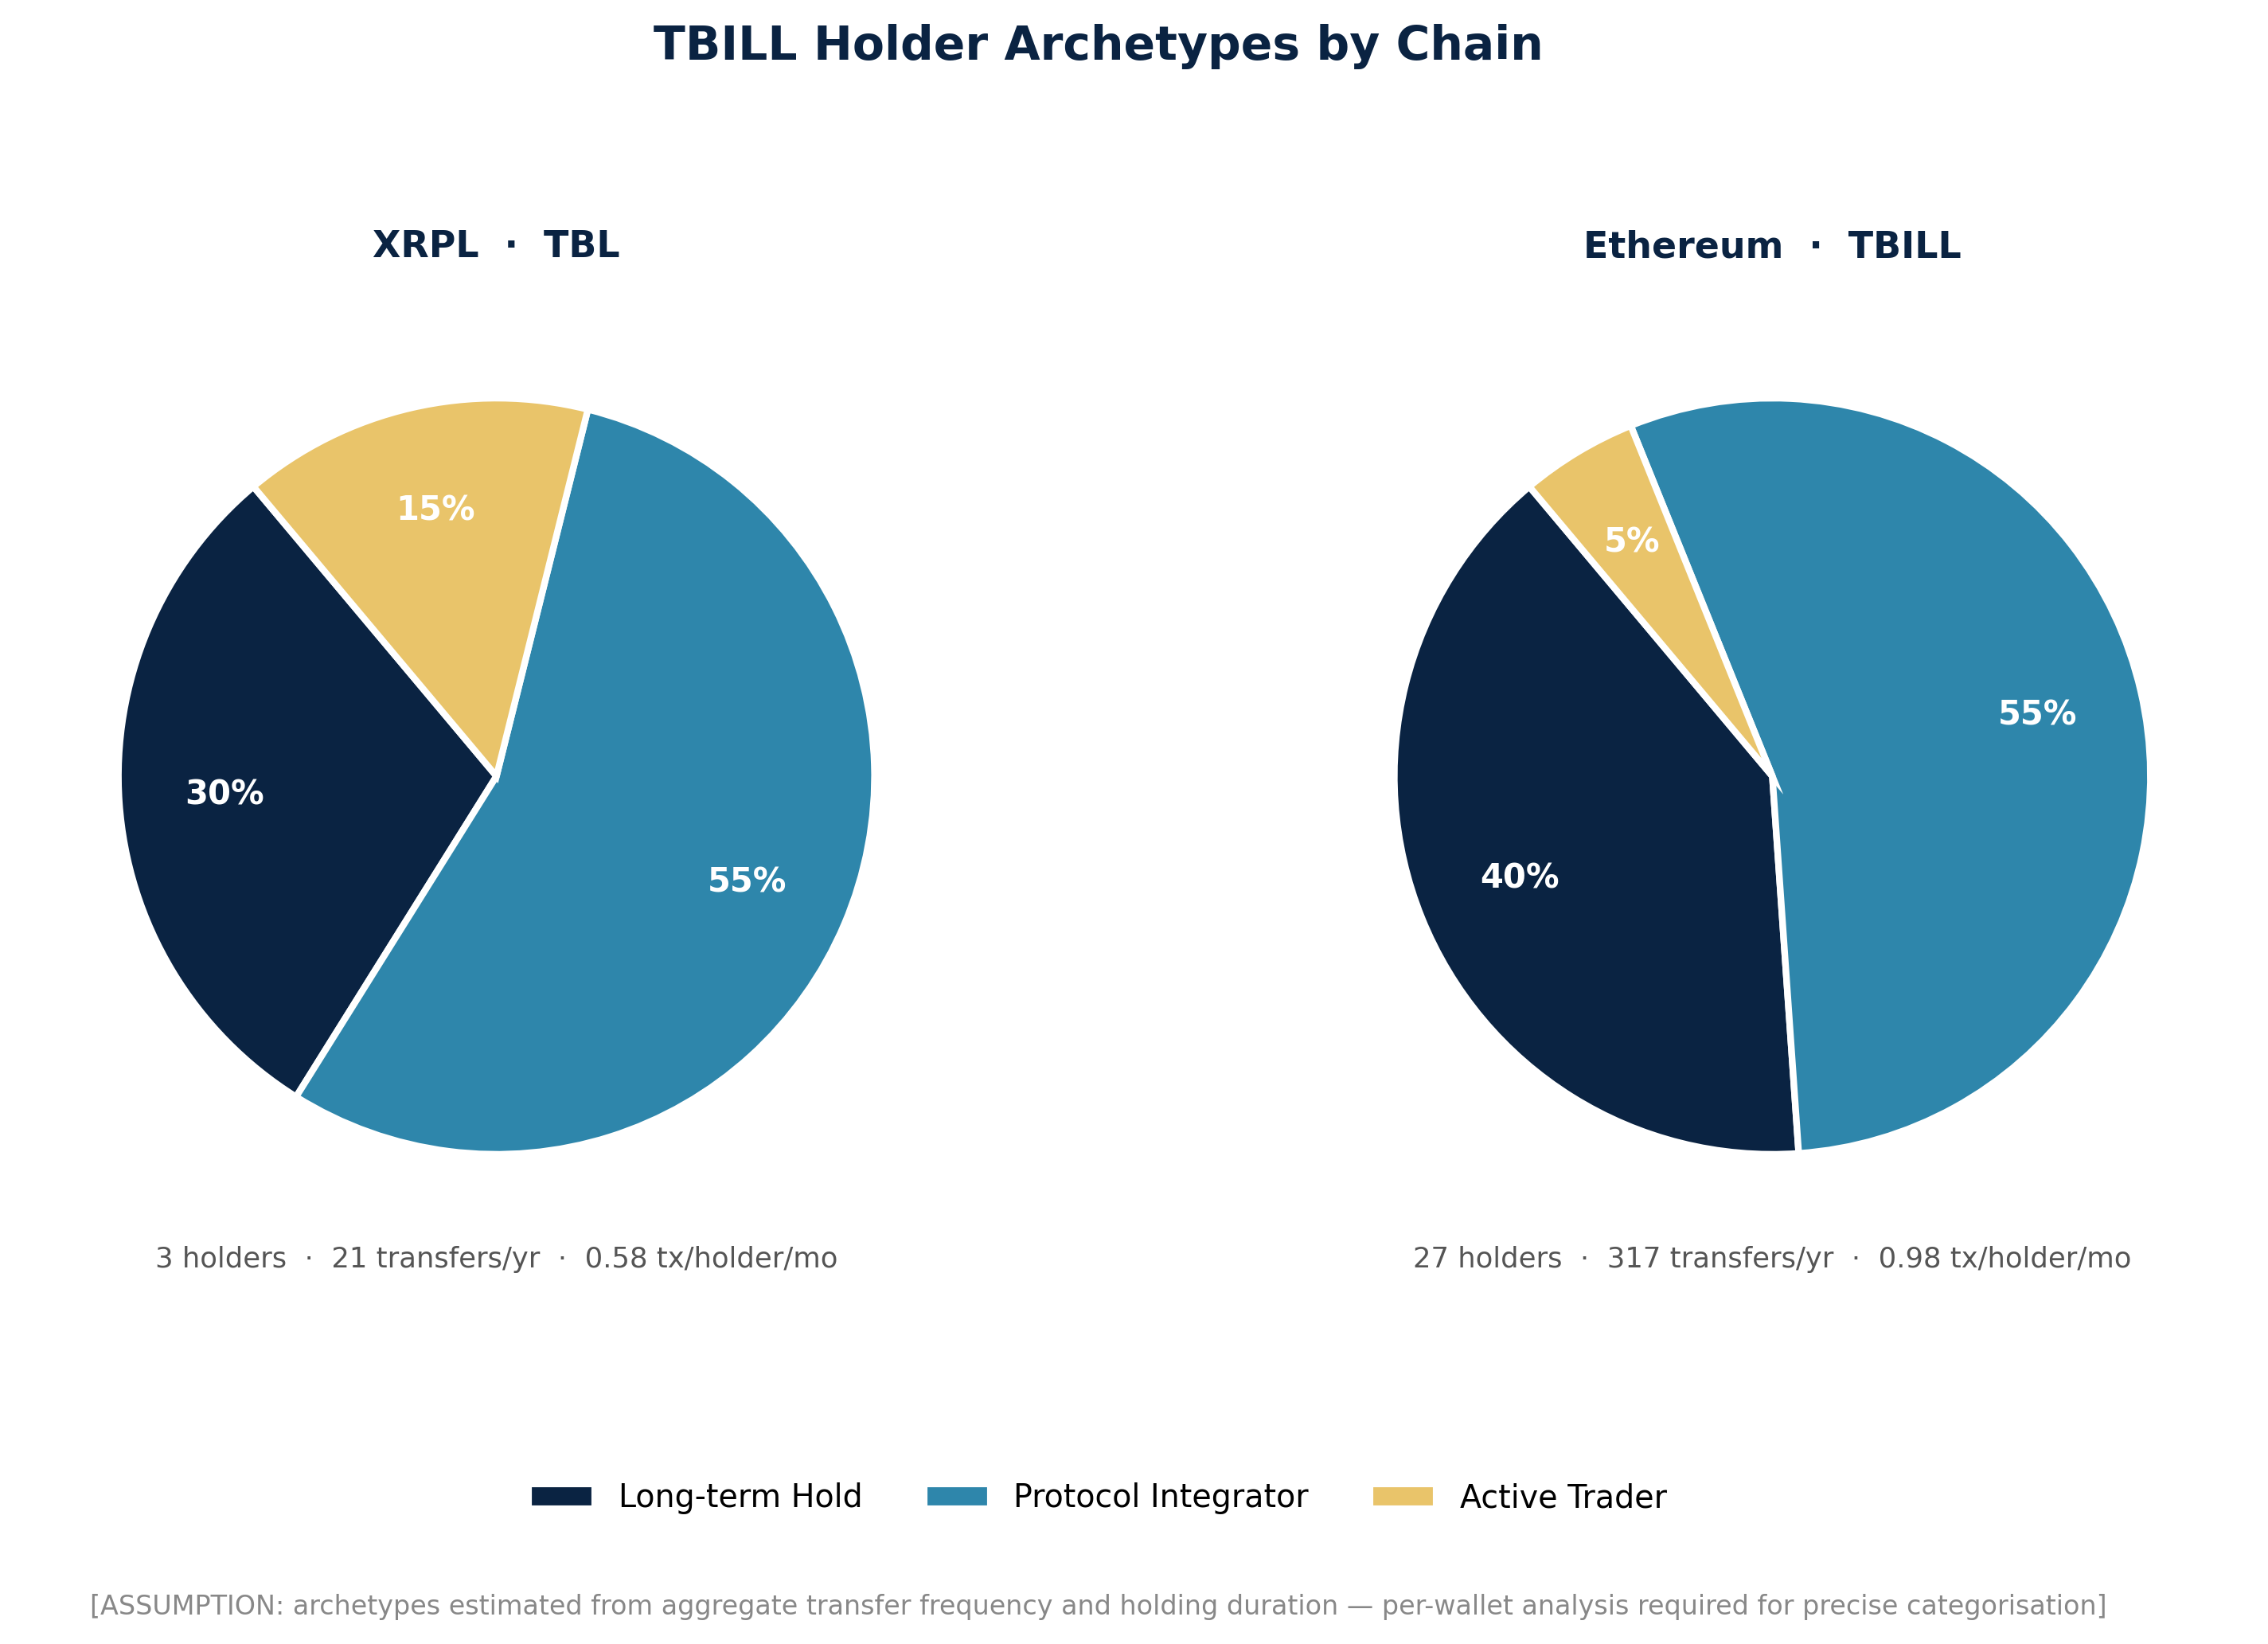
XRPL vs Ethereum TBILL activity analysis, a Doppler Finance case study, a weighted chain priority matrix for USDO expansion, and three concrete 90-day recommendations to move XRPL from “storage” to “velocity”.
- Outputs: Case study, chain scoring model, 90-day action plan
- Finding: Large velocity gap between XRPL and Ethereum TBILL transfer activity
Module 3 — USDO Supply Scenarios & Cohort Context
A 12‑month bear/base/bull scenario model for USDO supply, plus a root-cause analysis of the post‑incentive drawdown using cohort boundaries derived from structural inflection points in the supply series.
- Outputs: Scenarios and actions, hypotheses H1/H2/H3 with noted data gaps
- Artifact: Cohort-flow diagram for “peak → steady state” retention
Artifacts (charts + cohort flow)
How it’s built
Raw data is cached, transformations have unit tests, and the analysis produces Markdown deliverables so the work can be re-run or updated.
Project structure
openEden Consulting Project/
├── reports/                 # Final deliverables (Markdown)
├── data/                    # Cached raw + processed artifacts (timestamped)
├── src/
│   ├── collectors/          # Data ingestion (RWA.xyz, DeFiLlama, etc.)
│   ├── analytics/           # Metric computation + cohort analysis
│   └── formatters/          # PDF generation, report artifacts
└── tests/                   # Unit tests for transformations
Runbook
cd "openEden Consulting Project"

# Run the full pipeline (collect → analyze)
make run-all

# Run tests
make test
Takeaways
- Velocity ≠ custody: XRPL holds a large share of tokenized T‑bills but shows much lower TBILL transfer volume than Ethereum — driven by composability and secondary-market rails.
- Supply drawdowns are cohort-shaped: USDO’s post‑incentive contraction fits a cohort retention problem (peak → steady state retention) rather than a “single narrative” issue.
- Sourcing and uncertainty: Claims are sourced or flagged with
[ASSUMPTION]/[DATA: as of]; low-confidence comparisons are called out.