The Eye in the Sky: Integrating AI with Flight Telemetry (Part 2/3)
Introduction
A drone that can fly is a toy. A drone that can see is a robot. In Part 1, we built the body. Now, we have to give it a brain. The goal wasn’t just to record video of the road—that would still require a human to watch hours of footage. The goal was edge computing: processing the video live, on the drone, to identify potholes instantly.
In this specific implementation, I’m building a solution for Zimbabwe, where road maintenance is a critical challenge. By automating the discovery of potholes, we can create a real-time map of road defects.
In this post, I’ll dive into the software architecture, explaining how I connected a Raspberry Pi 5 to a Cube Orange Flight Controller and the Python code used to synchronize computer vision detections with GPS coordinates.
The Hardware Stack
This isn’t just a standard drone; it’s a flying edge server. Here’s the specific loadout:
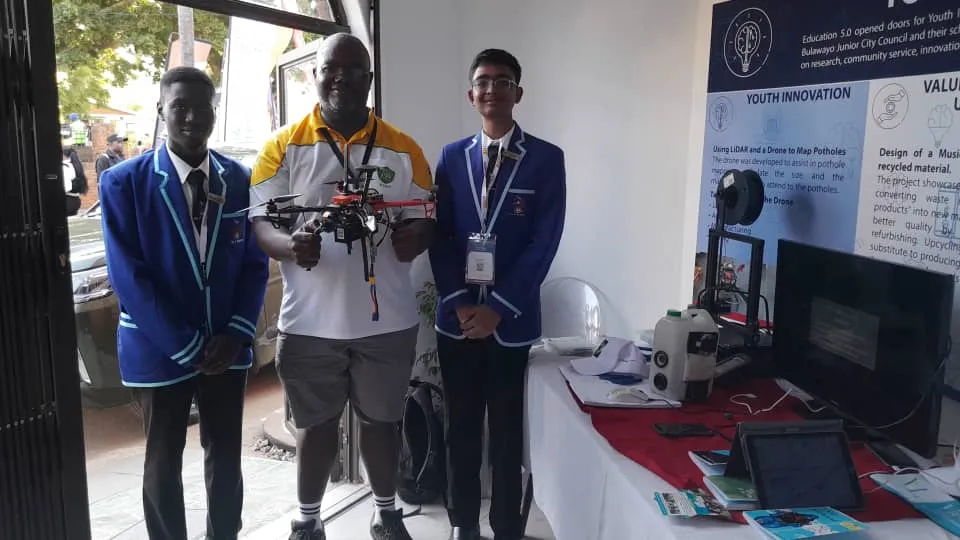 The drone’s hardware stack on display. Visible is the integration of the Cube Orange flight controller and the Raspberry Pi 5 “brain” that powers the YOLOv8 vision pipeline.
Hardware Integration & Wiring
Connecting the “pilot” (flight controller) and the “brain” (Raspberry Pi) required careful hardware selection and wiring to ensure reliability under flight vibrations.
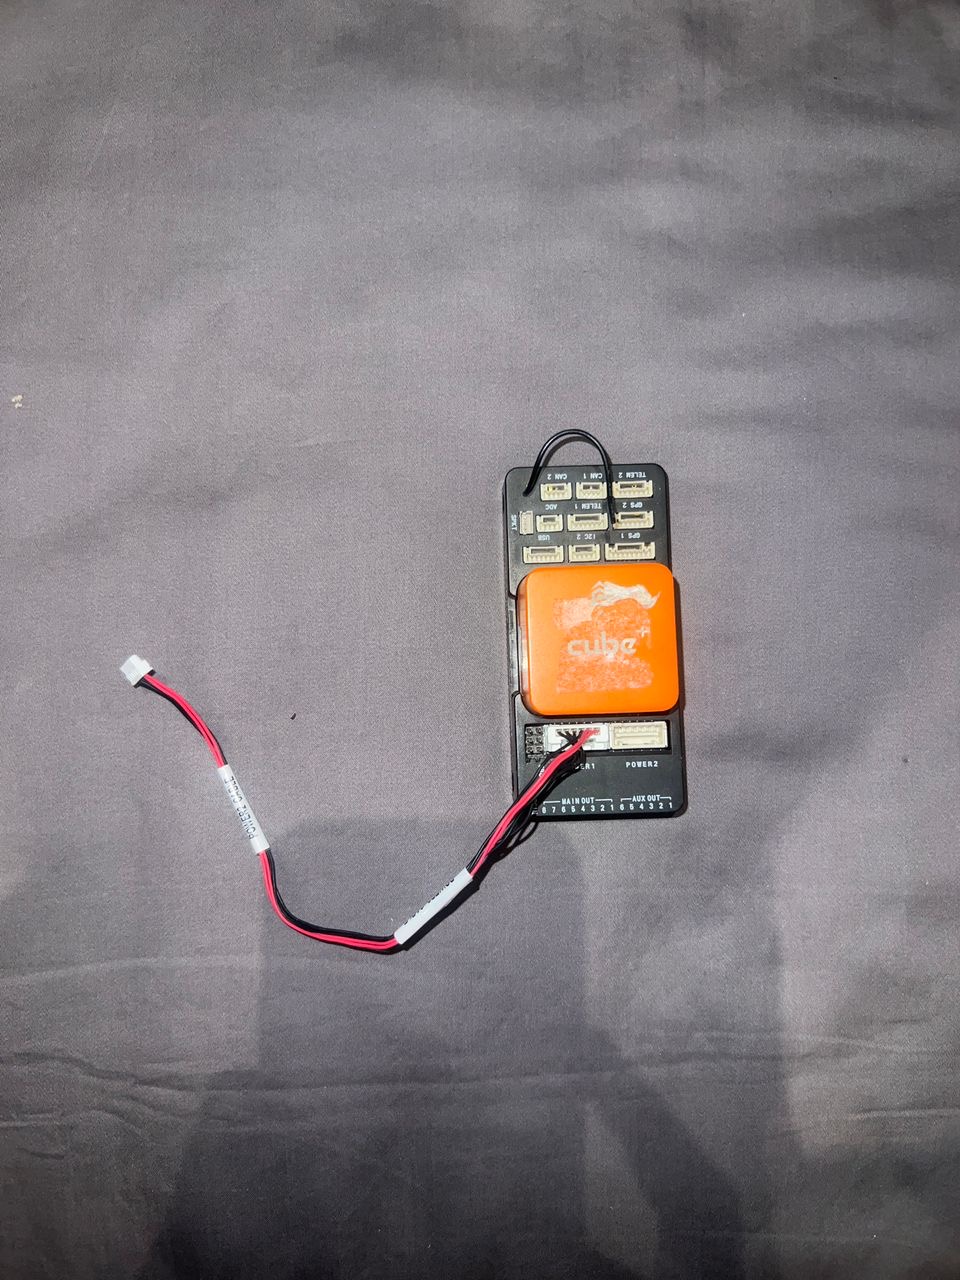 The Orange Cube flight controller, which manages the drone’s flight stability while communicating telemetry data to the Raspberry Pi.
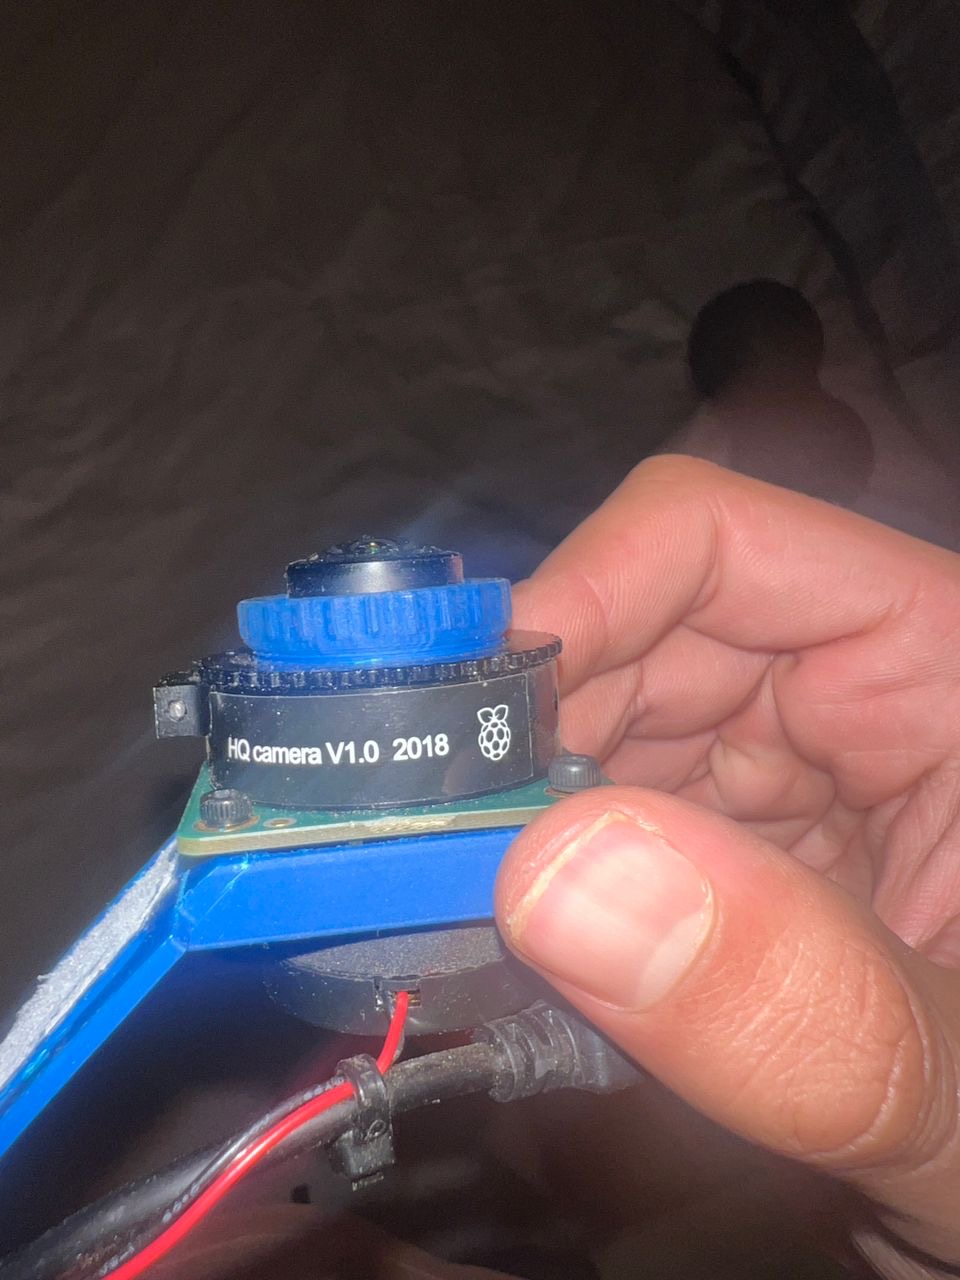 The high-quality 12MP camera module used for the vision pipeline, providing the resolution needed for accurate pothole detection from higher altitudes.
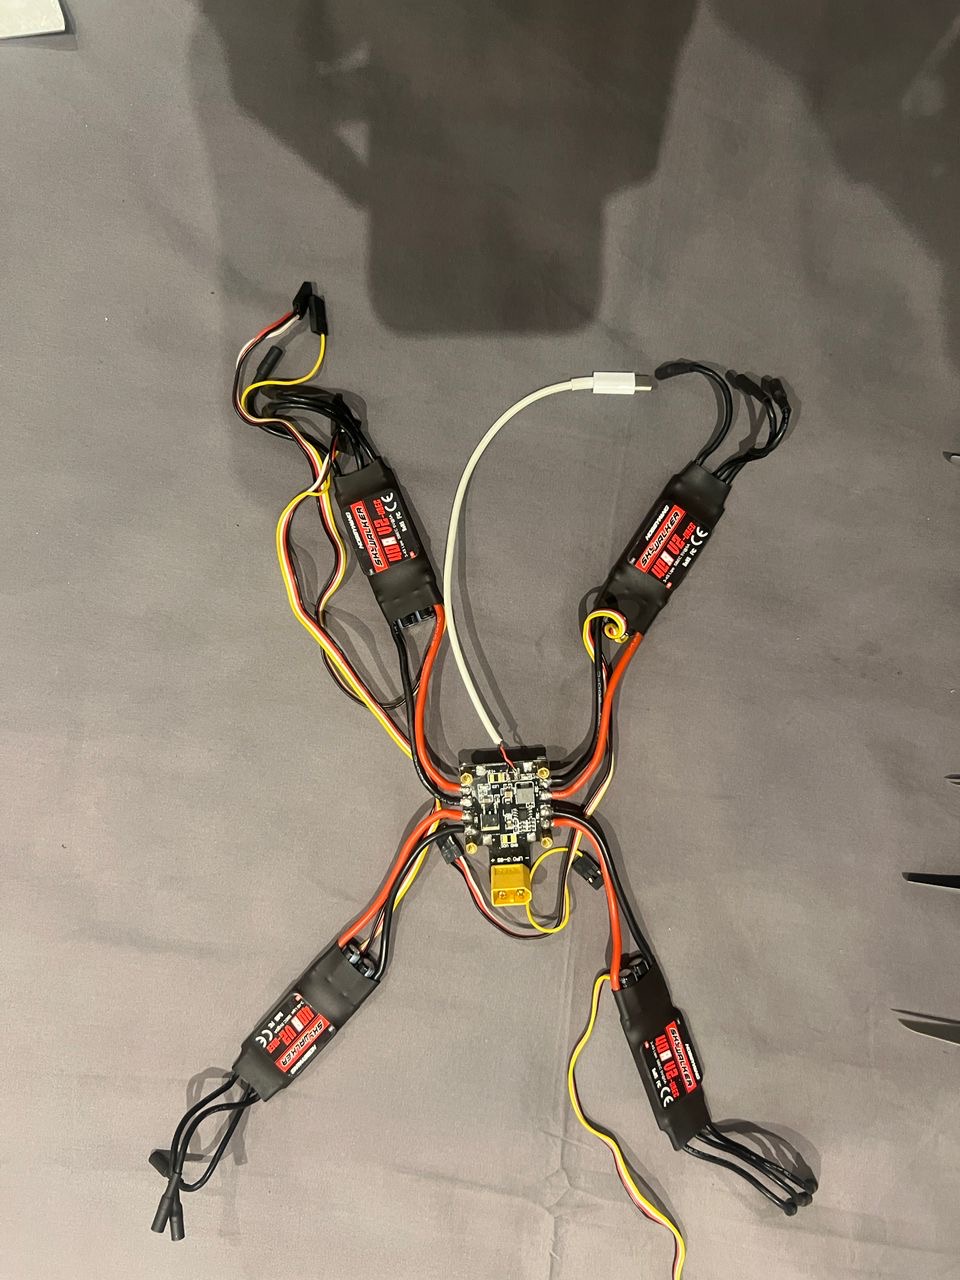 A look at the internal wiring and Electronic Speed Controllers (ESCs) that translate the flight controller’s commands into high-power motor movements.
-
The Pilot (Cube Orange + Here3 GPS):
- The Cube Orange handles the flight physics, stability, and motor control.
- The Here3 GPS provides RTK-ready positioning precision, crucial for pinpointing exactly where a pothole is on a map.
-
The Brain (Raspberry Pi 5):
- I chose the Pi 5 for its increased inference speed over the Pi 4. Real-time object detection is computationally heavy.
- Connectivity: A 5G/LTE Cellular HAT with an Econet SIM card.
- Network Config: To get online in Zimbabwe, the APN is set to
econet.net. This allows the drone to upload pothole data to the cloud in real-time, rather than waiting for the drone to land to offload SD cards.
The AI: Seeing the Road
For the “eyes,” I needed a model fast enough to run on the Pi but accurate enough to distinguish a pothole from a shadow.
- Model Architecture: YOLOv8 (You Only Look Once). It’s the industry standard for real-time object detection.
- Dataset: I utilized the Potholes-Detection-YOLOv8 dataset from Kaggle. It contains over 1,500 annotated images, which served as a perfect starting point for transfer learning.
The Code: Syncing Vision and Location
The biggest challenge was timing. When the camera sees a pothole, we need the exact GPS coordinate of that millisecond. If we are late by even 2 seconds, the drone (flying at 15 m/s) will be 30 meters away from the actual defect.
The Implementation
I used the dronekit Python library to bridge the two systems and ultralytics for the AI. Here is the core logic that runs on the Raspberry Pi 5:
from dronekit import connect, VehicleMode
from ultralytics import YOLO
import cv2
import time
import json
import requests

# --- Configuration ---
CONNECTION_STRING = '/dev/ttyAMA0' # UART connection to Cube Orange
BAUD_RATE = 921600
CONFIDENCE_THRESHOLD = 0.5
API_ENDPOINT = "https://api.my-road-map.com/v1/pothole"

# --- 1. Initialize The Pilot (Cube Orange) ---
print("Connecting to Cube Orange...")
vehicle = connect(CONNECTION_STRING, wait_ready=True, baud=BAUD_RATE)
print("Connected to Vehicle!")

# --- 2. Initialize The Brain (YOLOv8) ---
print("Loading YOLO model...")
model = YOLO('pothole_v8_nano.pt') # Using the nano model for speed on RPi
print("Model Loaded.")

# --- 3. The Mission Loop ---
cap = cv2.VideoCapture(0) # Standard Pi Camera or USB Cam

def get_telemetry():
    """Fetches the current state of the drone."""
    if not vehicle.location.global_frame:
        return None

    return {
        "lat": vehicle.location.global_frame.lat,
        "lon": vehicle.location.global_frame.lon,
        "alt": vehicle.location.global_relative_frame.alt,
        "heading": vehicle.heading
    }

print("Starting Patrol...")

try:
    while True:
        ret, frame = cap.read()
        if not ret:
            break

        # Run Inference
        results = model(frame, verbose=False)

        # Process Detections
        for result in results:
            for box in result.boxes:
                confidence = float(box.conf[0])

                if confidence > CONFIDENCE_THRESHOLD:
                    # POTHOLE DETECTED!

                    # 1. Capture the critical telemetry IMMEDIATELY
                    telemetry = get_telemetry()

                    if telemetry:
                        timestamp = time.strftime("%Y-%m-%d %H:%M:%S")
                        print(f"[{timestamp}] Pothole Detected at {telemetry['lat']}, {telemetry['lon']}")

                        # 2. Prepare Payload
                        payload = {
                            "type": "pothole",
                            "confidence": confidence,
                            "location": telemetry,
                            "timestamp": timestamp
                        }

                        # 3. Upload to Cloud (via Econet 4G/LTE)
                        # We use a timeout so network lag doesn't block the detection loop
                        try:
                            # requests.post(API_ENDPOINT, json=payload, timeout=1)
                            # (Commented out for demo purposes)
                            pass
                        except Exception as e:
                            print(f"Upload failed: {e}")

        # Optional: Display frame (Headless mode usually disables this to save resources)
        # cv2.imshow('Drone Vision', frame)
        # if cv2.waitKey(1) & 0xFF == ord('q'):
        #     break

except KeyboardInterrupt:
    print("Mission Aborted.")

finally:
    cap.release()
    vehicle.close()
    print("Connection Closed.")
Key Takeaways from the Code
- Direct UART Link: We use
/dev/ttyAMA0at921600baud. This is a hardwired connection between the Pi’s GPIO pins and the Cube Orange’s TELEM2 port. It eliminates USB latency. - Nano Model: I’m using
pothole_v8_nano.pt. On edge devices, you trade a tiny bit of accuracy for massive gains in Frames Per Second (FPS). - Asynchronous Uploads: In a production version, the
requests.postwould be pushed to a separate thread. We never want the network call to pause the video processing loop, or we might miss a pothole while waiting for a cell tower ping.
In Part 3, we’ll look at the map data visualization and how to turn these CSV coordinates into a heatmap for the Department of Transport.